DataMap System Details
DataMap - System Details
OverviewThe Datamap is a tool that integrates all the sources of data within an organization, contains information on the various organizational data systems and enables users to obtain an extensive understanding of the organizational data by tracking how it is created and classified, where and how it is stored and how the data moves from one system to another.
The Datamap contains extensive information on each system/subsystem/project/entity such as the document types existent within the it, whether it contains sensitive data, the data sources, the applicable retention labels, associated risks and their controls to name a few.
The information under the different systems of the Datamap can also be edited, updated and deleted depending on input from various other sources such as the responses from surveys, DSARs, retention uploads and so forth.
This guide covers all the details and features of the DataMap System Details section which is found on clicking the System Names button on the DataMap homepage.
To access the Datamap module, follow these steps:
Log in to your Data Governance Tool account
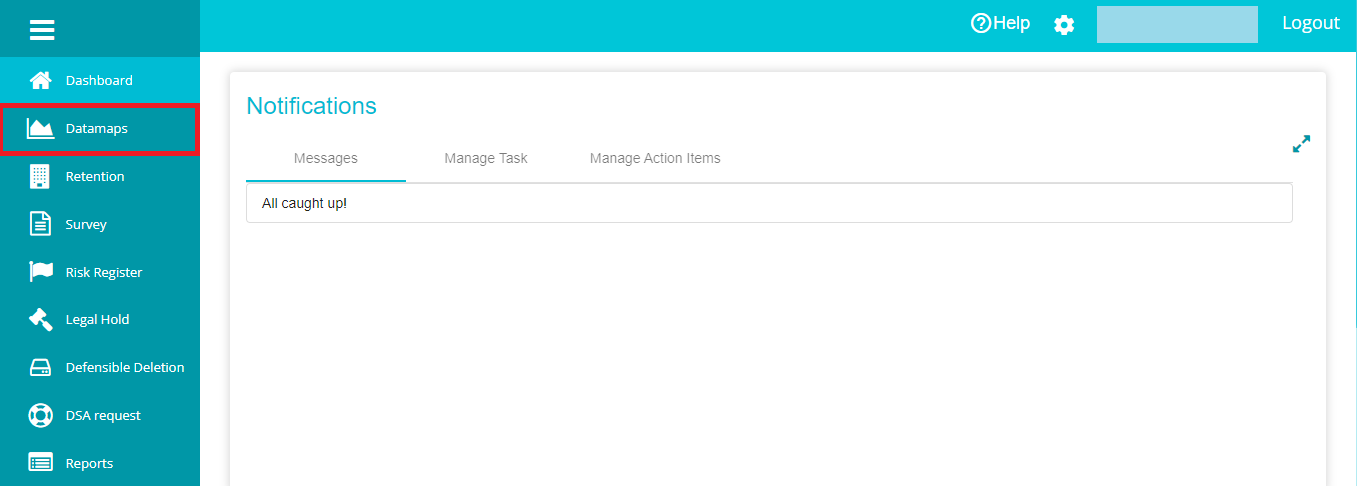
Once logged in, open and hamburger menu present on the top left of your screen and click on Datamaps
From the Datamap homepage, you can navigate to, view, and use its various features
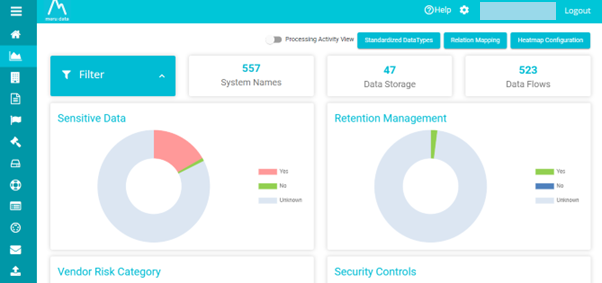
The System Names page contains the table of all the organizational data systems/subsystems/projects/entities and their details.
The System Names page has the following features:
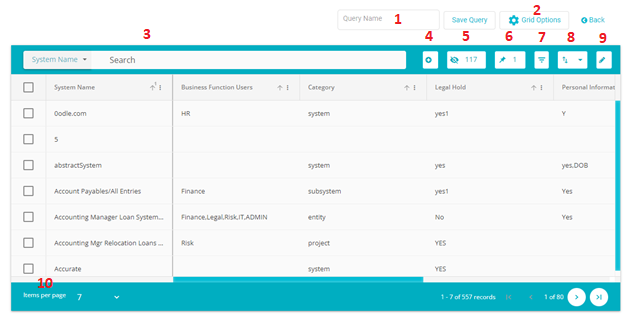
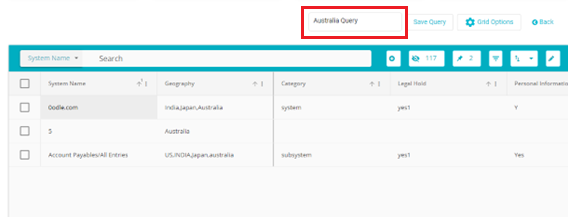
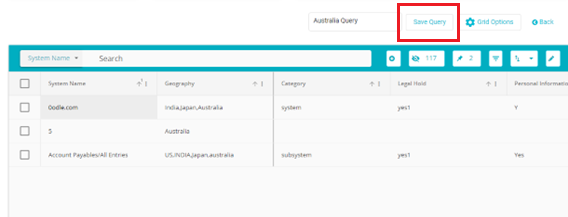
Query Name: Whenever any change has been made to the grid view, for example if any filter has been applied or certain fields have been pinned, a name can be given to this change and this change can be saved. Whenever you come to this grid again, you can select the saved change and only see the options on the grid that you previously selected. For example, say you only want the grid to display systems with Australia as the geolocation. First apply the filter. Once the appropriate results are displayed, add a name for this changed grid view
Next, click on the Save Query button
Once this query has been saved. You can click on the Grid Options button
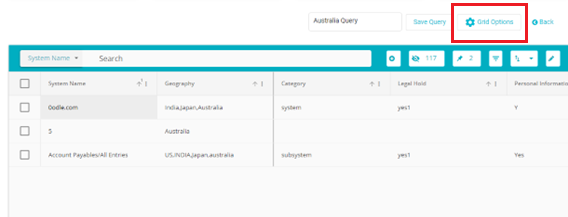
From the Grid Options menu, you can find the saved queries. Select the query of your choice to change the display of the grid according to the selected query
Grid Options: Here you can find a list of all previously configured and saved grid view changes
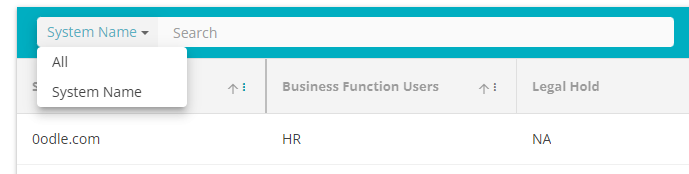
Search: The search bar allows you to search for any existing system. Type in the System Name in the space to get the relevant results. The search criteria can also be changed to "All" to get results from any attributes matching the search input.
Add: Click on (../img/Datamaps/DatamapSystemDetails/image10.png) to configure a new system which will be added to the Datamap
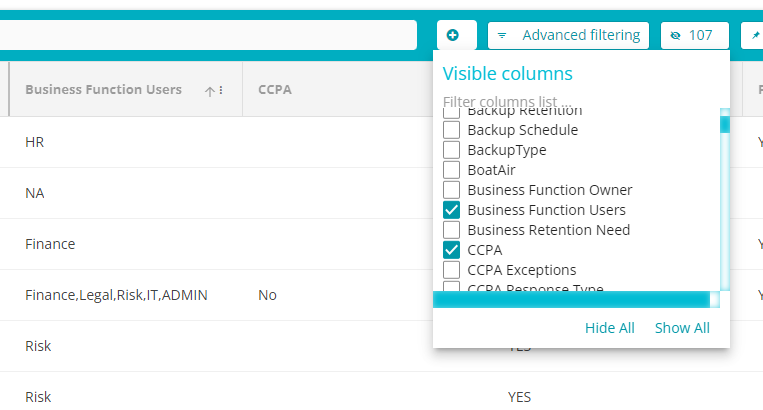
Visible Columns: From the drop-down menu that appears on clicking this button, select the columns (System Fields) you want visible on the table. The drop-down menu consists of all the System fields.
Pin: From the drop-down menu that appears on clicking this button

select the columns you want pinned on the table. The drop-down menu consists of all the System fields. This feature works similarly to a Freeze pane feature. Selected columns will remain pinned to the left side of the grid
Advanced Filtering: This feature can be used to filter results based on multiple conditions. Use the "And" or "Or" criteria to filter results. The information displayed on the grid will change according to the filters applied here.
Export: The contents of the table can be exported in an excel or CSV format by clicking this button and selecting the format preference.
Bulk Update: With this feature, updates and edits can be made to selected System fields of any number of systems at a time.
Select the column to be updated
Next select the operation to be performed
Finally select/enter the updated value for the fields.
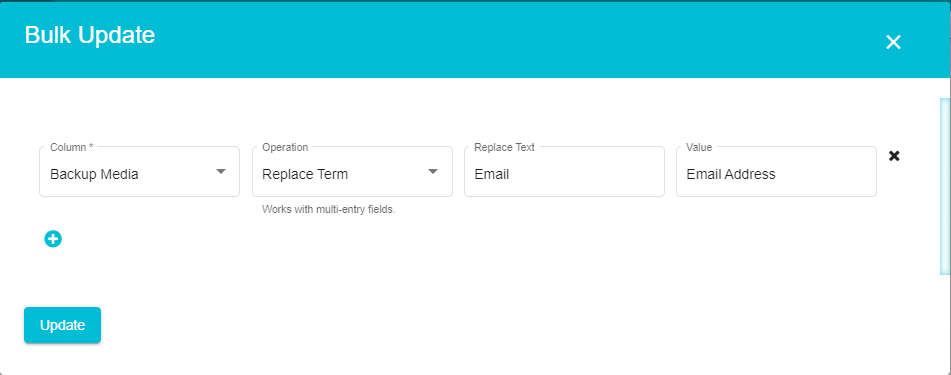
In the above example, in all the Backup Media fields on the Datamap Systems, the term 'Email' will be replaced with the term 'Email Address'. Updates to multiple fields can be made at a time by clicking the Add button and adding the other fields update specifications. Click the Update button to complete the process.
Items per page: Select the number of Systems to be visible per page of the table.
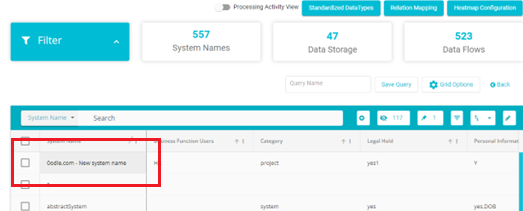
Click on the System Name to view the information and details corresponding to that system/subsystem/project/entity
This page shows the information of the selected System/Subsystem/Project/Entity
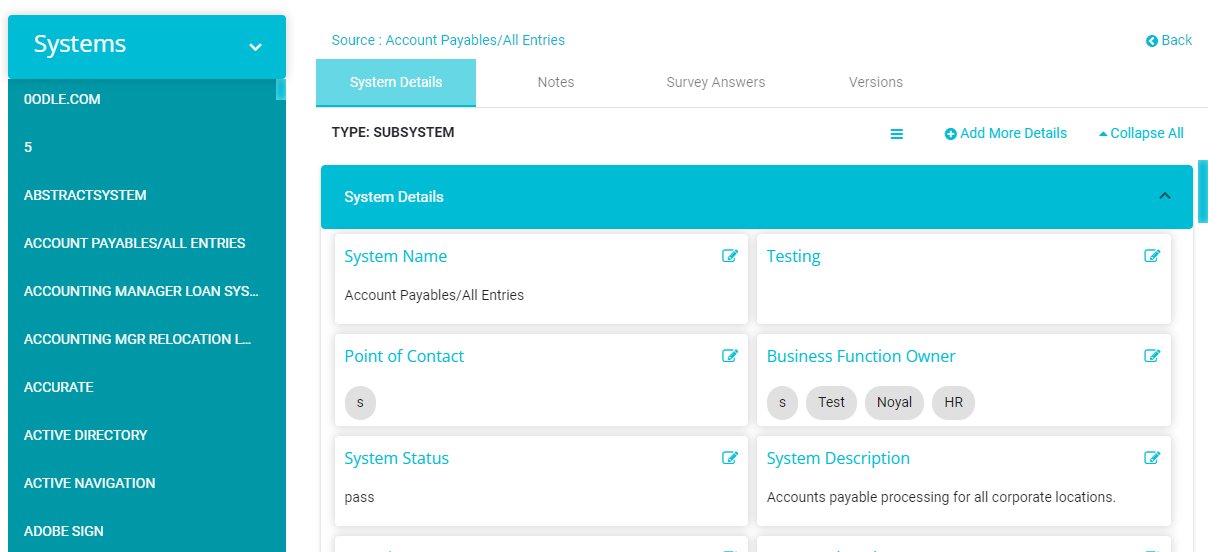
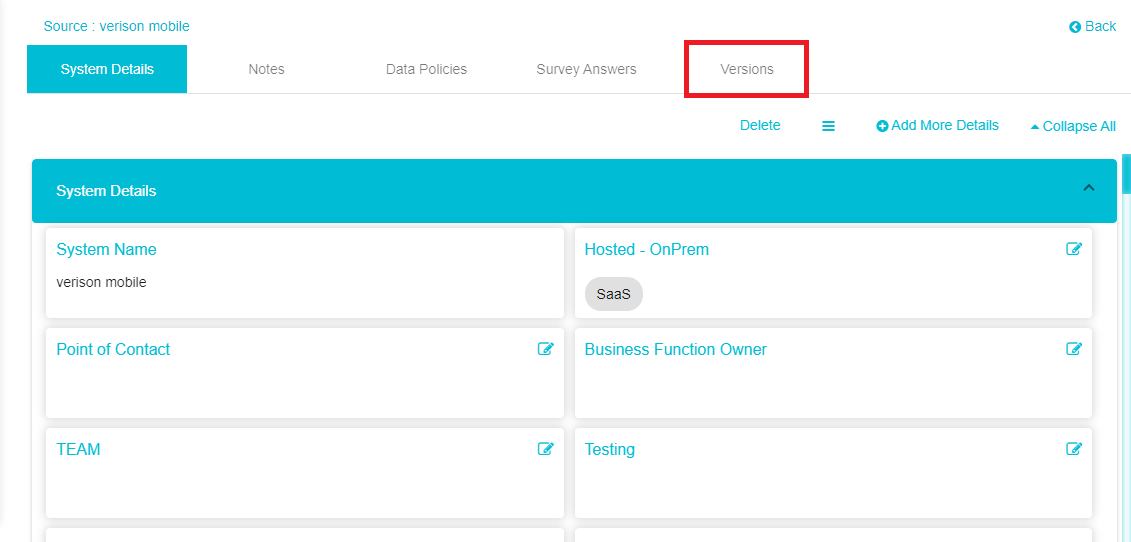
The System page is divided into 5 sections: System Details, Structured Data Types, Notes, Survey Answers and Versions
System Details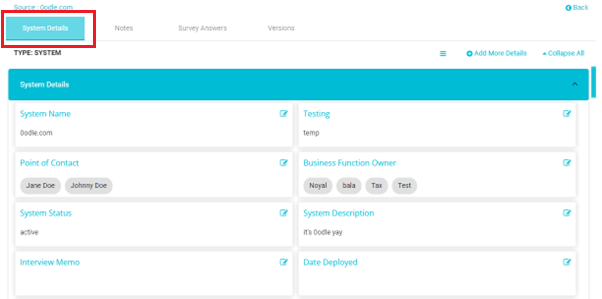
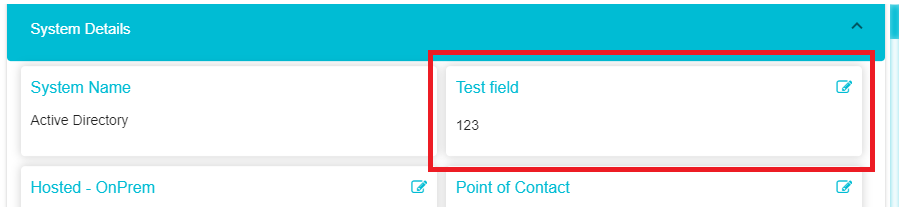
The System Details Section displays extensive information about the system/subsystem/project/entity, categorized into different categories such as System Details, Privacy, Security, Retention and Back Up, Risk Mapping, Vendor Statements, Contract, System Fields, DSARs etc. depending on your requirements.
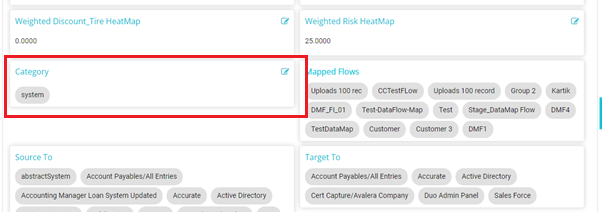
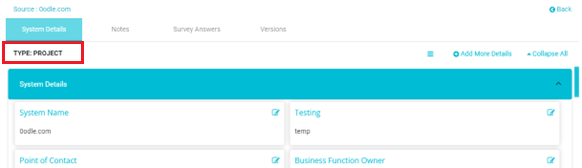
As we know, a Datamap comprises of different data sources (or data
stores). These data sources can be categorized as systems, subsystems,
projects, or entities. The category of the selected data source can be
seen on top of the page.
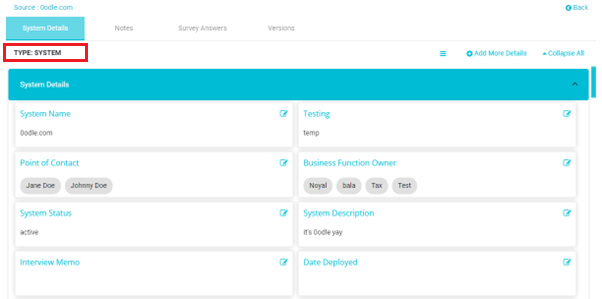
This data source category can be selected and changed depending on your requirements. Details on doing so can be found below.
The Datamap System/Subsystem/Project/Entity can be configured as per your requirements; the kind of categories in your System, their layout, the text type entered in the System fields and so forth. The details can be edited in two ways: First, value edits can be made to individual fields on the System Details page. Second, configuration changes can be made to the Groups (System Details, Privacy, Security, Retention and Backup etc.) and their fields on the Edit page. Both methods are discussed below.
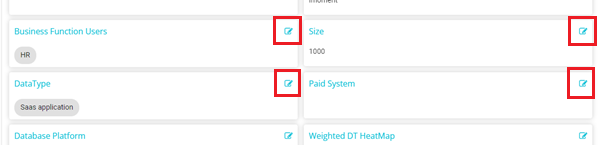
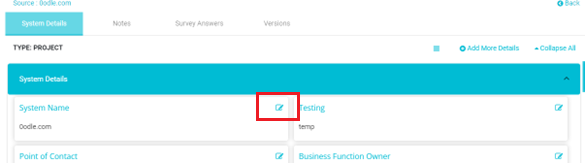
To edit fields on the System Details page, click on the edit button corresponding to that field
For example, to change the name of the datamap:
Click on the Edit button corresponding to the System Name field
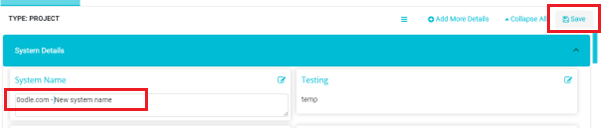
Type in the new value for the system/subsystem/project/entity and click on the Save button
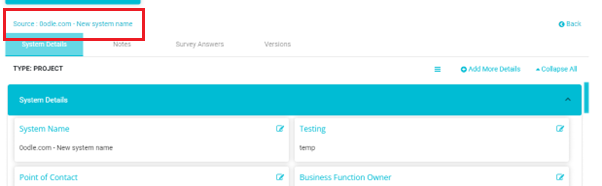
The system/subsystem/project/entity name will now be changed
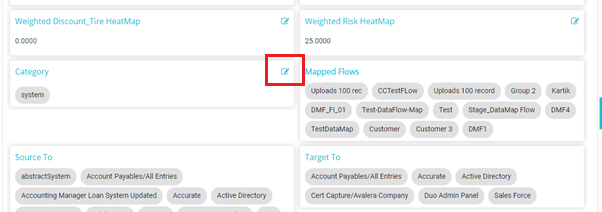
Another common change made on the System Details page is the data source Category change.
To do so, scroll down to find the category field
Click on the Edit button
Remove the current value and from the drop-down select the required data source category
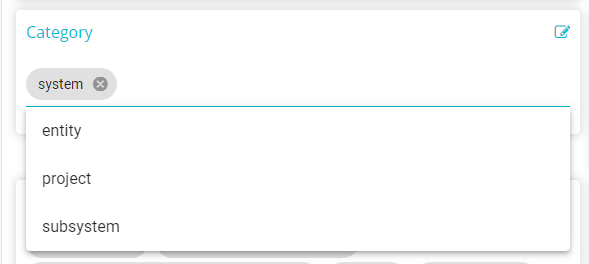
Click on the Save button
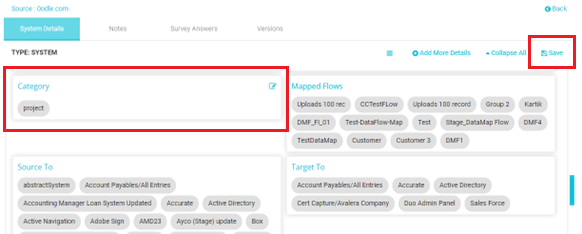
The data source category will now be changed
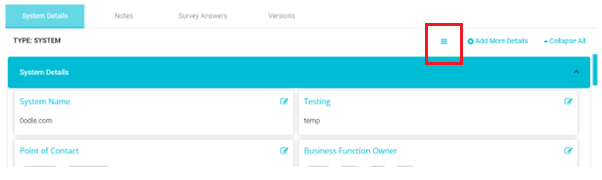
Configuration changes can be made to the different Groups (System Details, Privacy, Security etc.) of the data map from the Edit page. To make such changes, follow these steps:
Click the Edit Layout button
The Edit Layout page will open with all the existing data categories of the System
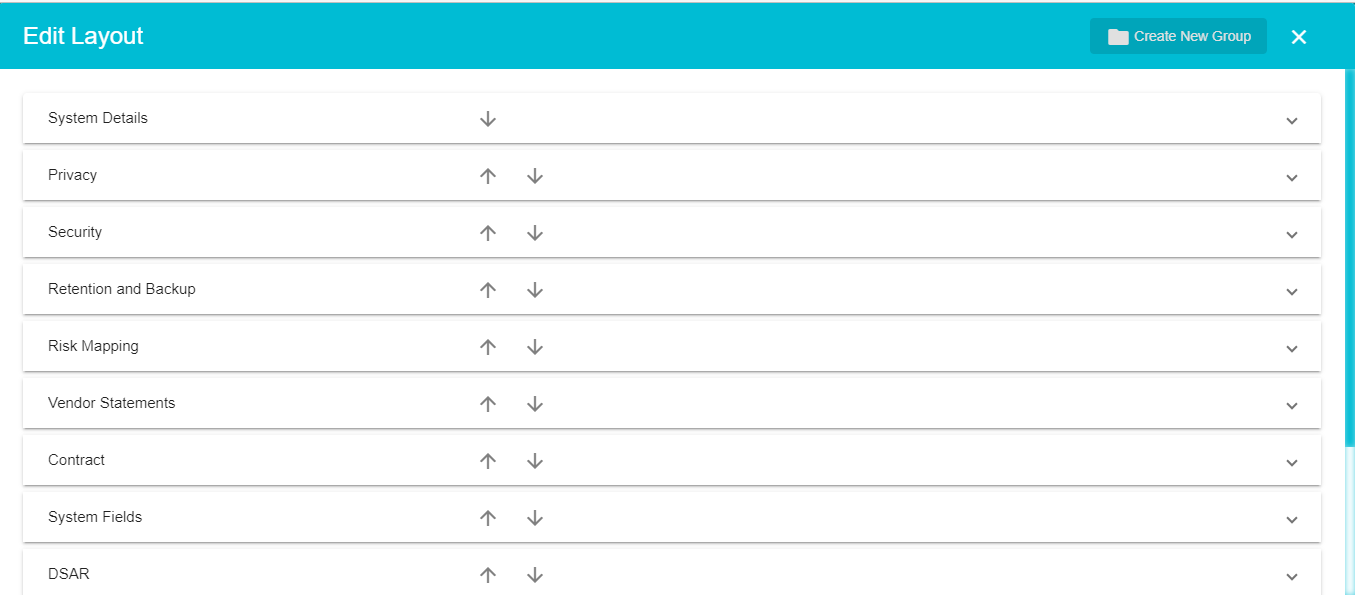
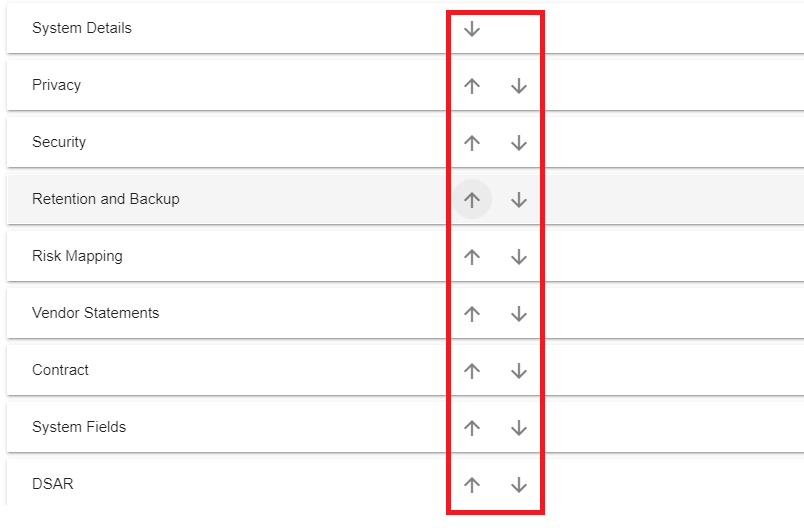
Click the arrow of any category to set the change and set the order of the categories. Clicking on the top pointing arrow will move that category one place higher, similarly, clicking the arrow pointing down will move that category one place lower.
Click on any of the categories to configure the fields under that category
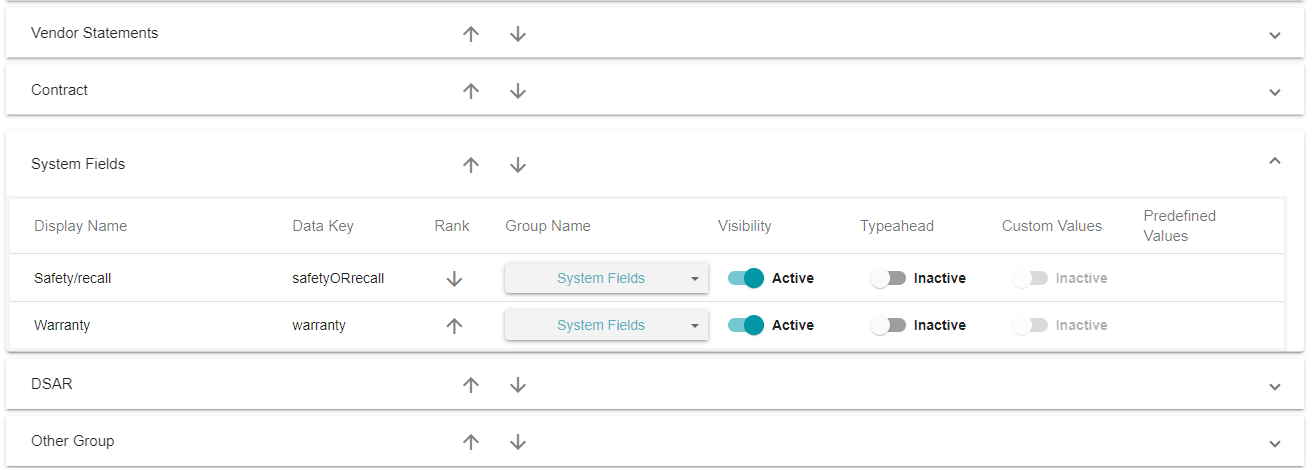
Display Name: Enter the title of the field here. In the below example, Deployed Date is the Display for that field

Data Key: This is the backend key used to identify the system field
Rank: Click the top arrow to move the field one place higher and the arrow pointing down to move the field one place lower.
Group Name: From the drop-down menu, select the Category to which the field should be placed under.
Visibility: Fields can be hidden from the System Details page if needed by making the field Inactive here
Typeahead: By activating the Typeahead feature, the user is presented with a drop-down table of suggested values that can be entered into the field. Multiple values can be selected from the drop-down. New values, that aren't on the drop-down, can also be typed in. When Typeahead is not activated, the field will remain a normal text entry field. In the example below, Typeahead has been activated.

- Custom Value: When Custom Value is activated, new values typed in, that aren't present on the drop-down menu, will be added to the drop-down menu once the updates have been saved. In the example below, the value -- Example value will be added to the drop-down menu for the Hosted field.
Note: Custom Value can be activated only once Typeahead has been activated


- Predefined Value: Once the Typeahead has been activated, the option to Add or Update the values in the drop-down menu will appear here.

- On clicking on the Add/Update Button, the Predefined values page will open. Here you can add values to the drop-down menu
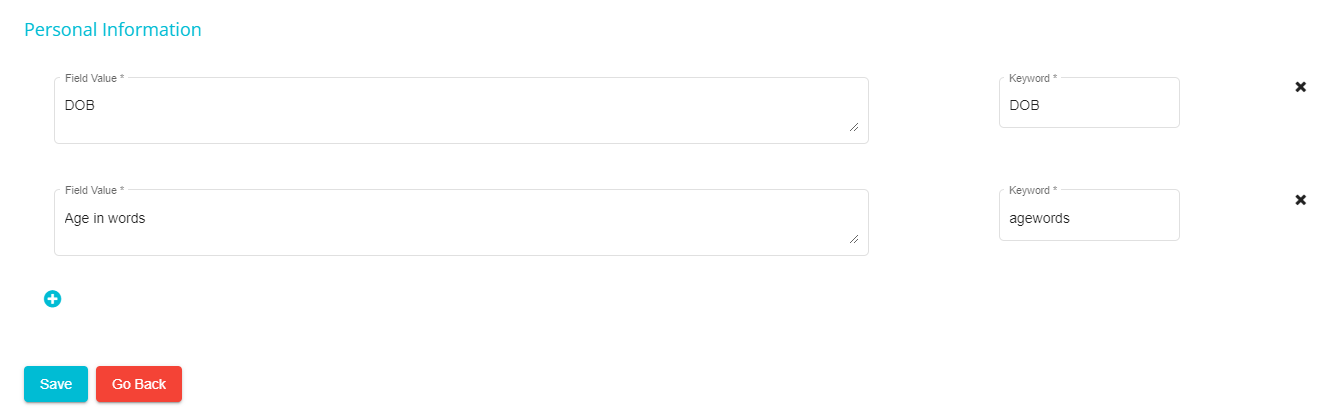
Field Value: Enter the name for the value to be added in the drop-down menu.
Keyword: Similar to Data key, enter the term with which the backend can identify the value.
 : Click this button to define more
values
: Click this button to define more
valuesClick the Save button to save the changes
The values will now be added to the drop-down menu

Click the Create New Group button to add and configure a new System Group

Here you can define the name of the new group

To add new fields to the System Groups, click the Add More Details button on the System Details page
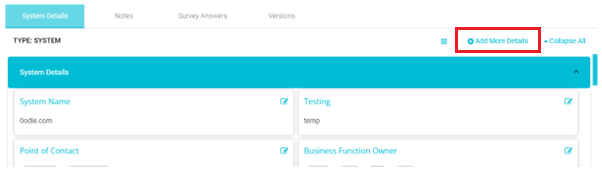
The Add Details pane will appear
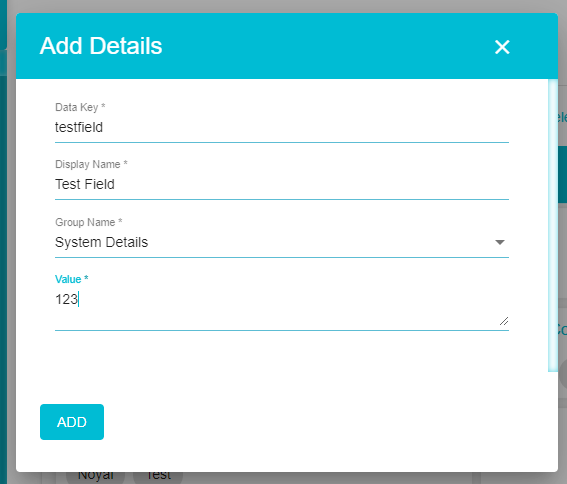
Data Key: This is the backend key used to identify the system field
Display Name: Enter the name of the field
Group Name: From the drop-down menu, select the group to which the field should belong
Value: Enter the value for the field
Add: Click the Add button to save the changes
The new field with its value will now be visible on the Datamap
In this way, you can create a new Group and add different fields and their details to it.
Note: Fields need to be added to a group for that group to be visible in the System Details section. If you create a new group but fail to add any fields to that group, then that group will not be displayed in the System Details section.
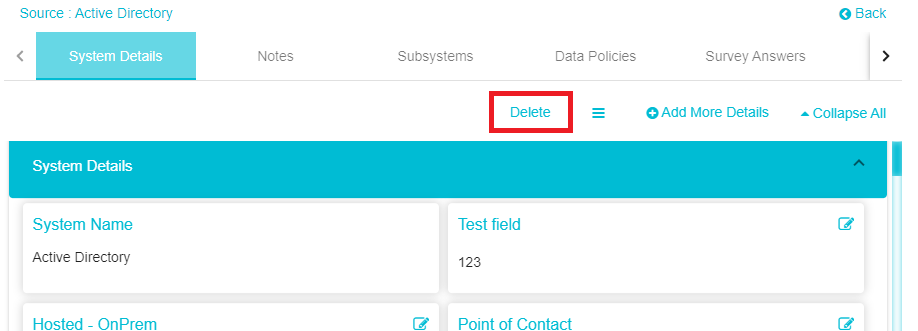
To delete the Datamap, click the Delete Button
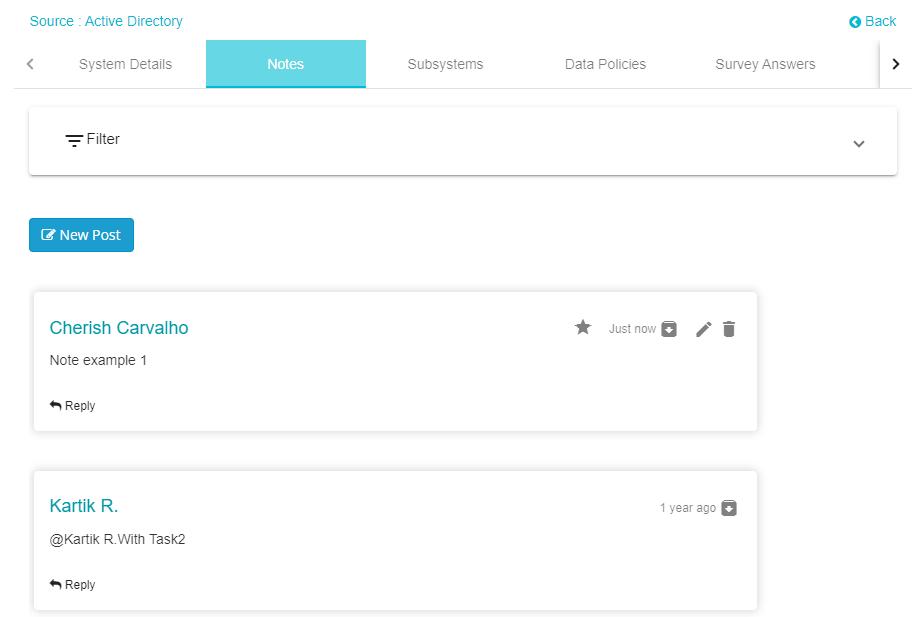
The Notes feature can be used to assign tasks to other users and to leave comments and remarks against different areas, features, functionalities on Data Governance Tool. Notes can be categorized as To do, Important, Question, Idea or Critical as per the requirement. Here, notes can be made against different Systems. These notes can be accessed by other users who have access to that particular system.
To create a new note
Click on New Post

Next enter the text or title for the Note in the Add a Post field.

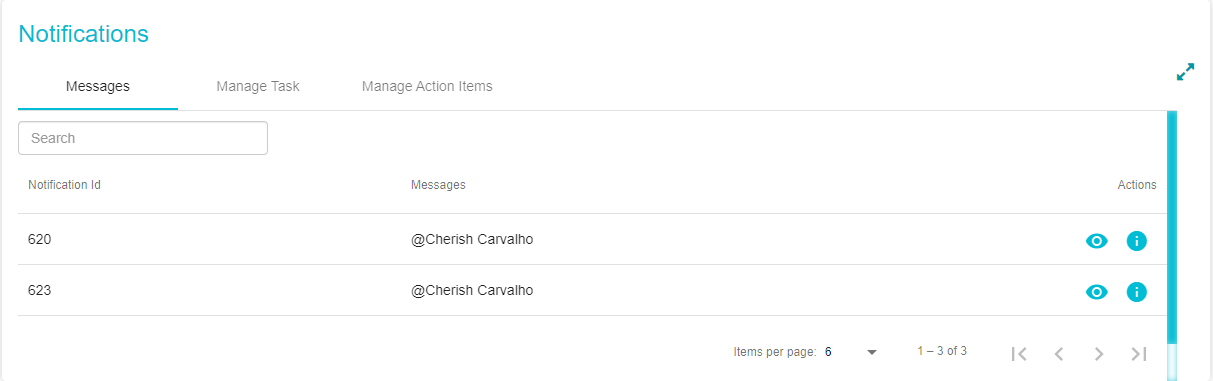
Here you can add the names of users by adding the @ symbol before their name. On doing so, the same note will appear on their Dashboard; under Messages on the Notifications section.
Once users' names have been added in the Add a Post field, a Task icon will appear to the right of the field . The steps to create a task can be found below
Categorize the Note by clicking on the Categories icon and selecting a category from the drop-down menu


Add an attachment if needed

From the drop-down menu, select the Tags needed for the Note
Once the Note has been created, click
 to save and send the Note
To assign a Task
Precede the name/s of the users to whom the Note should be directed with the @ symbol in the Add a Post field. Once you enter @, the list of users will appear in a drop-down menu

Once the users have been selected, the Task icon will appear

Click on the Task icon, the Task configuration pane will open
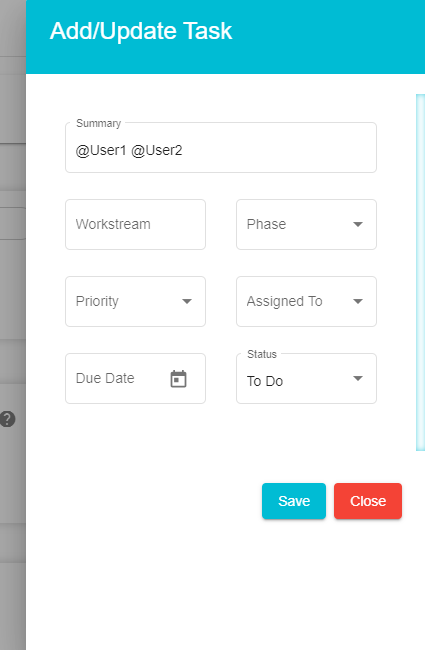
Workstream: Here you can add the name of the workstream to which the note would belong
- Phase: from the drop-down menu, select the Phase that the task is in
- Priority: Set the priority level for the task
- Assigned to: Select the users to whom the task is to be assigned
- Due Date: Set the date by which the task is to be completed
- Status: Select the current status of the task
Once the task has been configured, click Save.
Users to whom the Notes have been assigned will receive an email notifying them of the same. These notes will now be visible on the users Dashboard, under Manage tasks on the Notifications section.
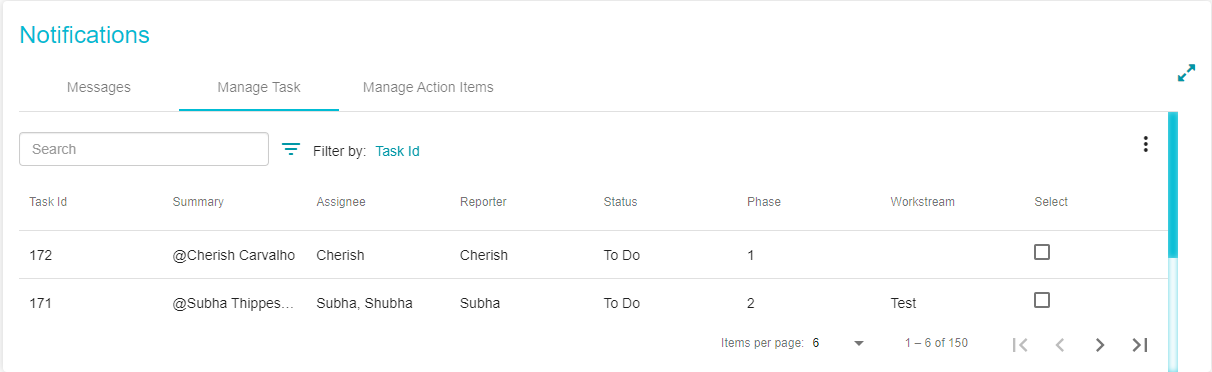
From here, they can track their tasks and make changes/updates to their tasks. Clicking on the task here will open the Task Config pane and changes can be made to the task as needed. For example, in case the task has moved from Phase 1 to Phase 2, the update can be made from here.
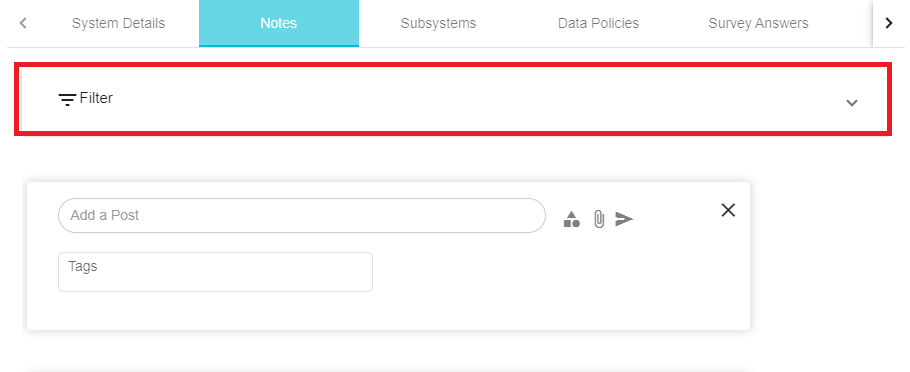
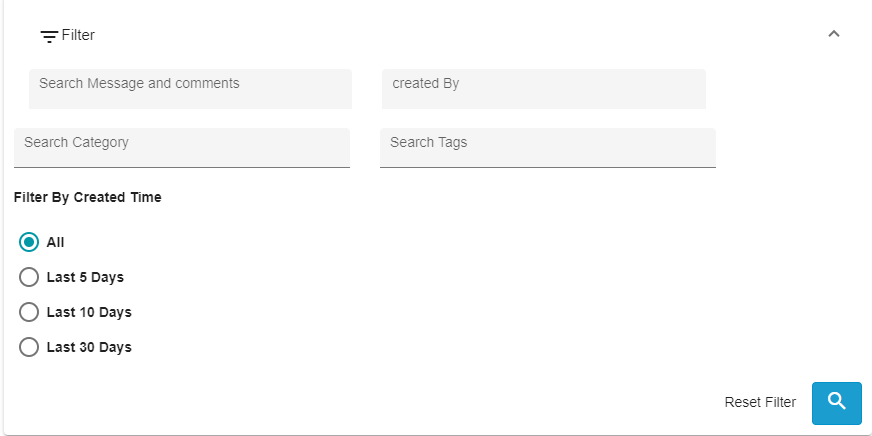
To search for a Note
Click on Filter
Here you can search for Notes by their content/message, the name of the user it was created by its' category or its Tags. Notes can also be filtered by time
Answers from Surveys can be mapped to Datamap Systems. Users can configure which datamap fields the survey answers are mapped to and how. Survey answers can be appended to, combined with or can replace current field values. The guide to mapping survey answers to Datamap Systems can be found here - Survey guide - Distribution details and Survey to datamap config.docx
Here we can see the Surveys associated with this System. When Survey groups are created, Datamap Systems are added to those groups. The surveys answered by the Survey groups associated with the particular system are found here.
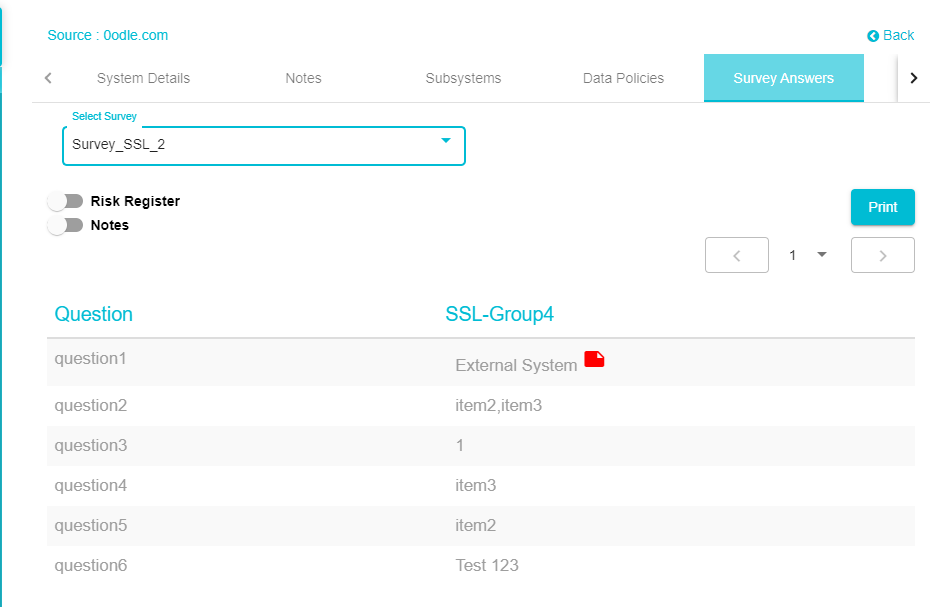
To view the survey answers
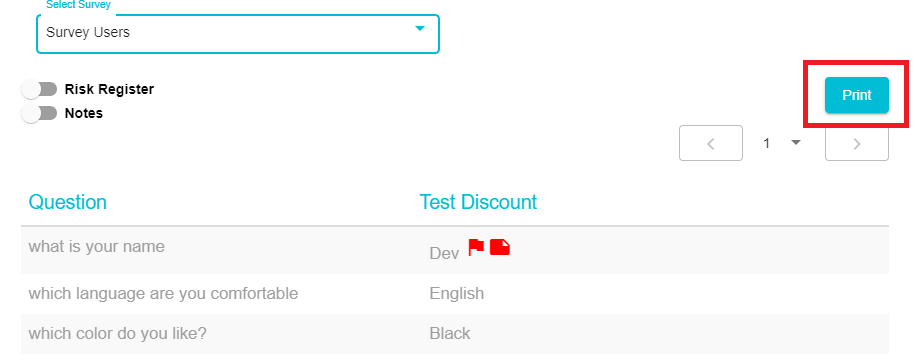
Select the survey of your choice from the Select Surveys dropdown menu
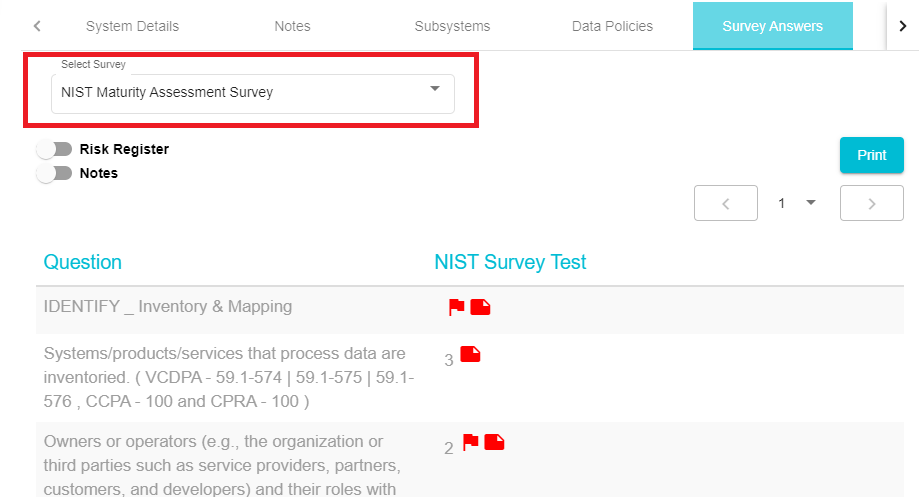
Here you can see the Survey questions and their corresponding answers. The Survey Group name is also visible here. In the above example, the Survey Group name is NIST Survey Test.
Enable Risk Register to add risks to the survey answers
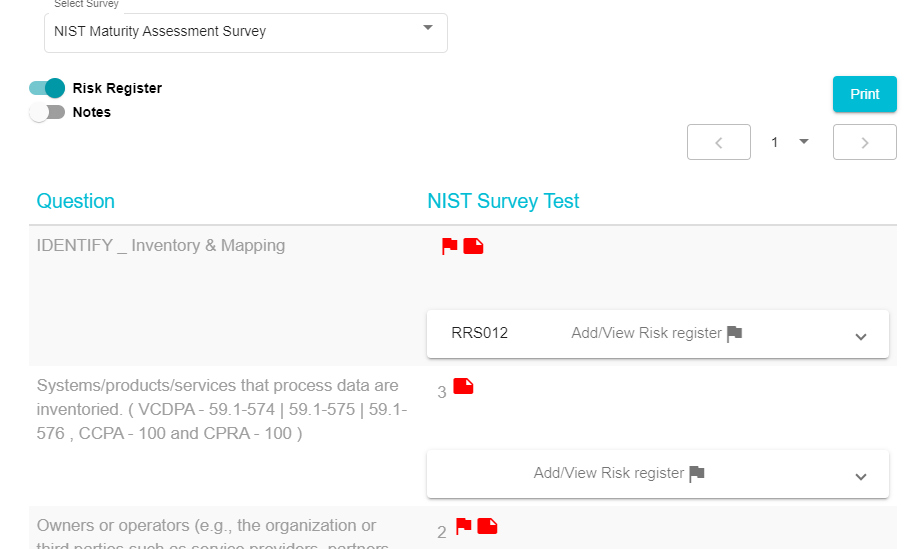
To add a new Risk, click on Add/View Risk Register
Search for Code: With this, you can name/select the code of the risk you are creating.
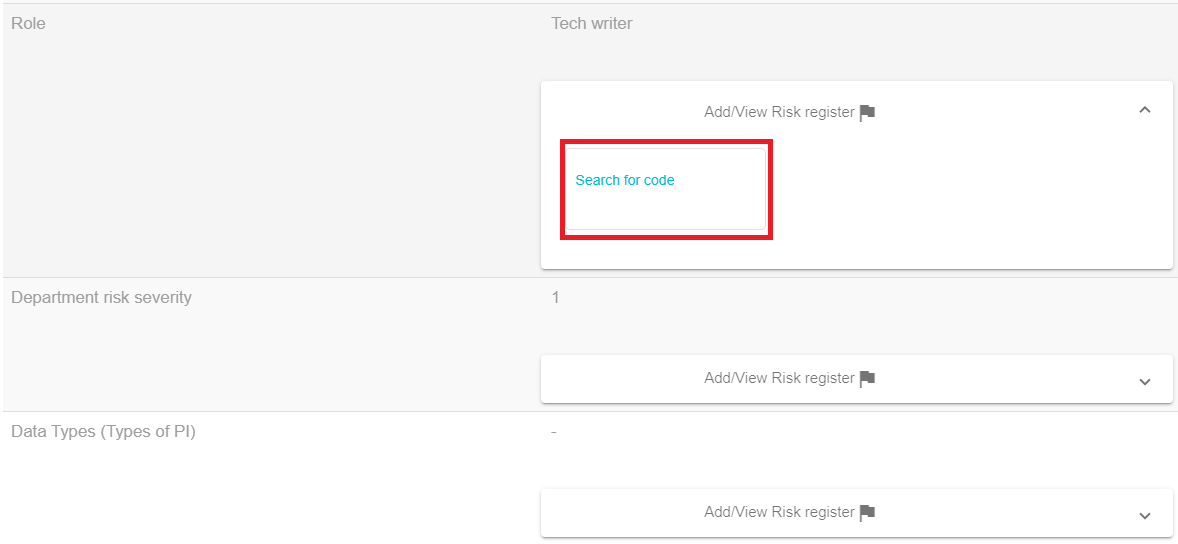
You can either create a new risk by clicking +New Or you can choose to add another iteration of an existing risk. You can search for the code of the risk you wish to create another iteration of by typing in the code in the Search for code box.
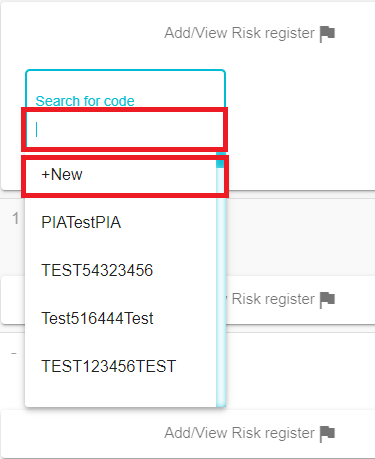
Creating a new iteration - from the drop-down menu, choose an existing risk to add another iteration of it. For example, you previously created a risk and added the code -- RiskCC. If you select RiskCC from the drop, then the code of the risk being configured will be RiskCC1. This code name will be autogenerated. If the code you selected from the menu is PIA256, then the code of the risk being configured will be PIA257. In another case, if the code selected is PIA, and PIA1, PIA2 and PIA3 already exist, then the code of the new risk being configured will be PIA4. The risk being configured, in this case, RiskCC1 will have all the configurations of the risk selected from the menu (here RiskCC) already set. However, they can be edited.
Select +New to create a new risk altogether. The risk configuration tab will open
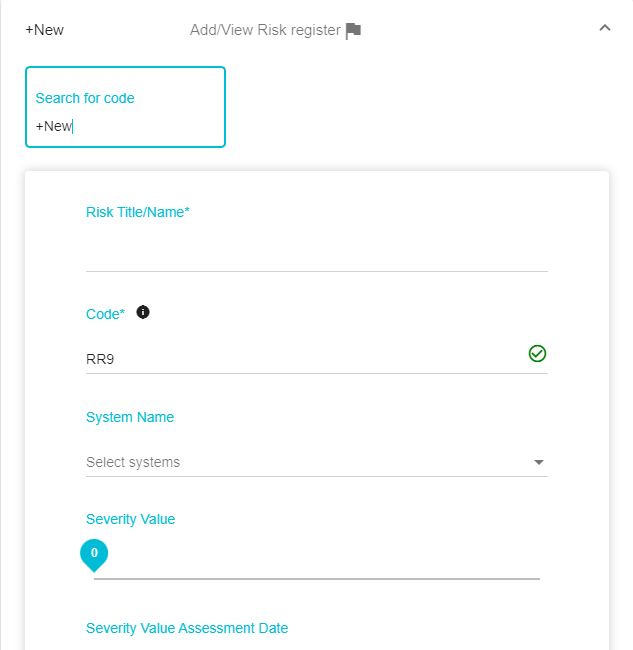
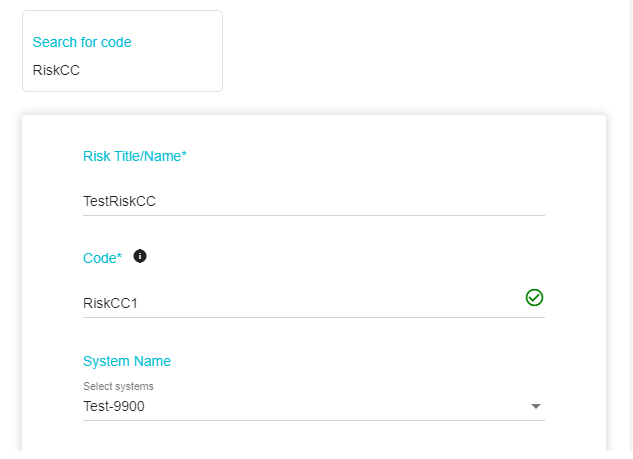
Risk Title/Name: Type in a name for the Risk you are creating.
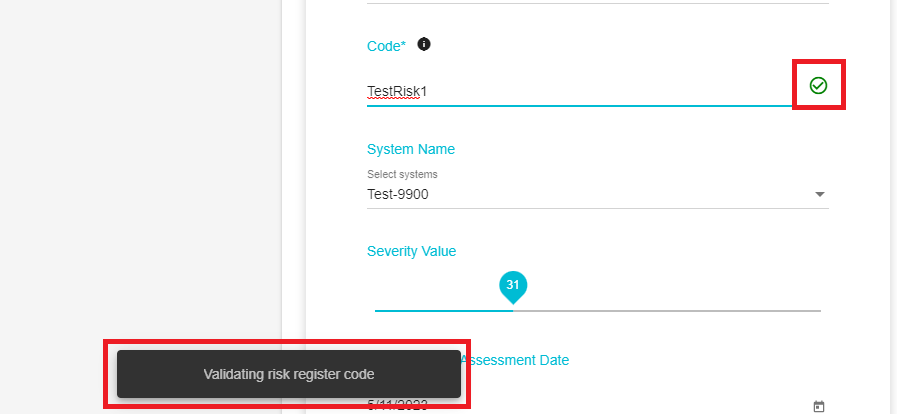
Code: Create a new code or make changes to the auto-generated code if needed Once the code name has been validated, the following message will appear, and a green tick will appear beside the code name. This happens to ensure that there aren't 2 risks with the same code name
System Name: Here, the System associated with the Survey Group will be preselected. If you are viewing the Survey Answers for the System Box, then Box will be preselected in this field. Risks can only be mapped to Systems that have been defined while configuring the Survey Groups. Hence, if the survey has been distributed a particular survey group associated with a particular survey, the risks can only be mapped to that system.
Severity Value: Set the severity value of the risk. The higher the number, the more severe the risk
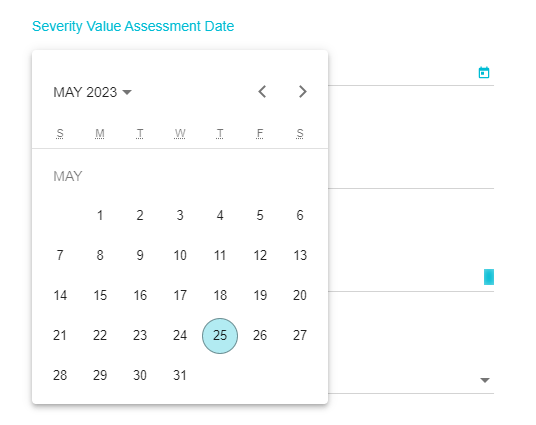
Severity Value Assessment Date: Select the date on which the risk should be assessed.
Risk owner: Select a user to whom the risk is to be assigned
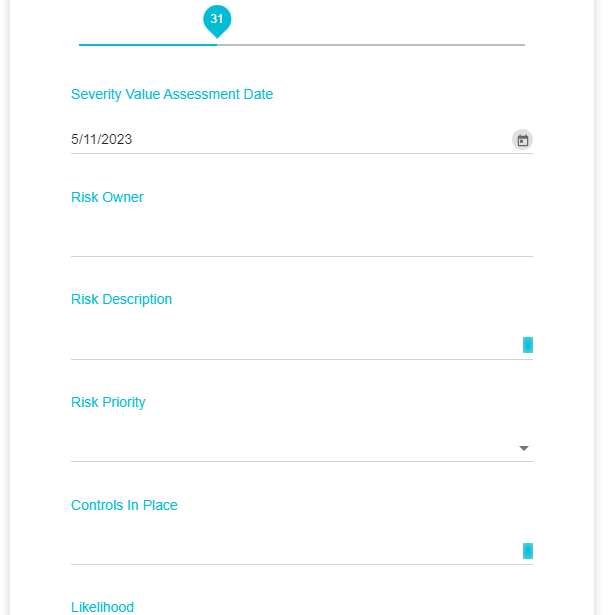
Risk Description: Provide a brief about the details of the riskhere.
Risk Priority: From the drop-down set the priority of the risk as required. This risk can be treated based on the selection made here

Controls in place: Here you can enter the measures that are currently in place to combat/prevent such risks. For example, NIST or ISO controls.
Likelihood: Set the likelihood of the risk occurring.
Type of Impact: Provide the type of impact anticipated due to the risk identified
Maximum Financial Impact: Enter the expected financial impact of the risk.
Once the configuration has been completed, Click Save
To add Notes, Enable the Notes Option
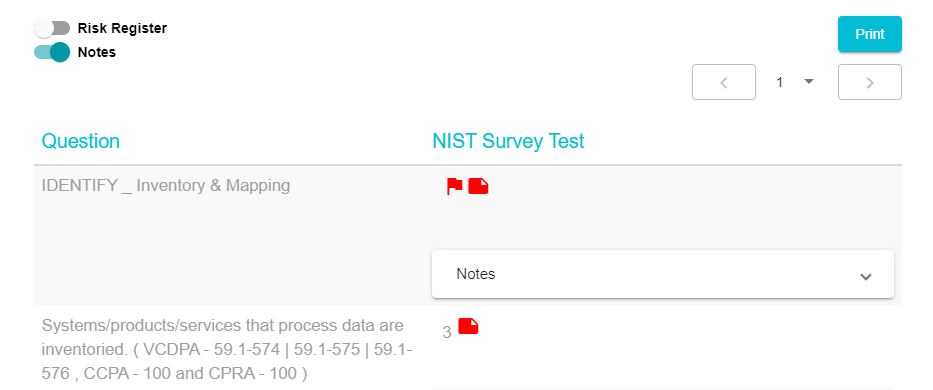
Click on Notes against the answer to which you want to Add a note.
Click on New Post and configure the note as per your requirements. The Notes can be configured in the same manner that you configured the Note in the Notes Section mentioned previously

The Survey Answers can be printed if required by clicking the Print button
A new version of a Datamap system is created whenever any update or edit is made to the system. The different versions can be compared with each other to identify what changes have been made and where they apply. Datamap versions are created with any change to the Datamap system.
Whenever a new survey answer has been mapped to the Datamap system, a new version of the system gets created.
Whenever a new system has been applied to a Retention Label, a new version of the system gets created.
Whenever additions/edits are made via the Uploads feature
Whenever additions/edits are made on the System Details page of the Datamap
Whenever additions/edits are made via the Bulk Update feature
Whenever Systems are added to a DSAR flow (if the Flow has been mapped to a DSAR Configuration) during the In Process phase configuration on the DSAR Configuration page.
Whenever DSAR flow Systems (that have been mapped to a DSAR Configuration) are edited while configuring the In Process phase on the DSAR Configuration page
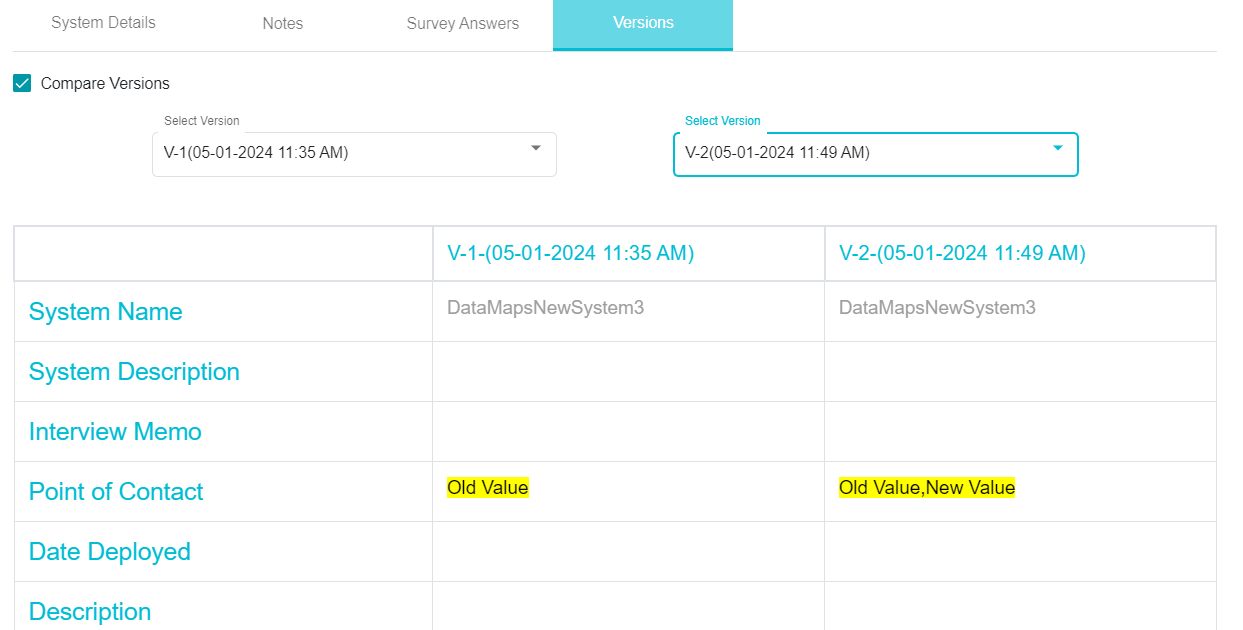
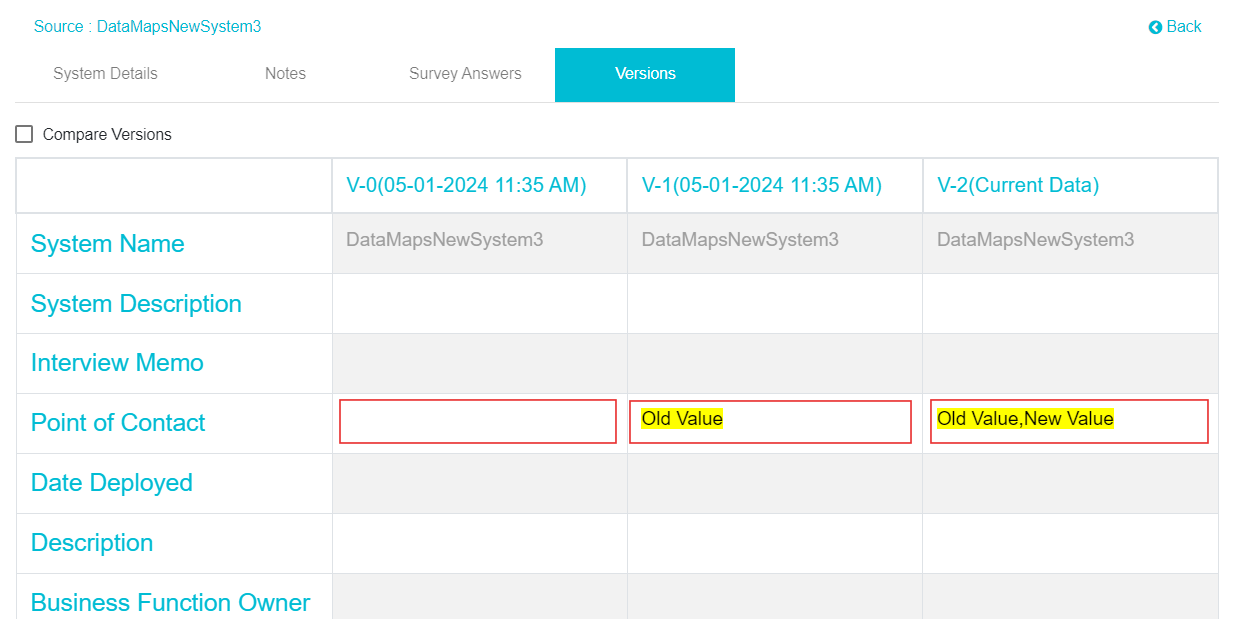
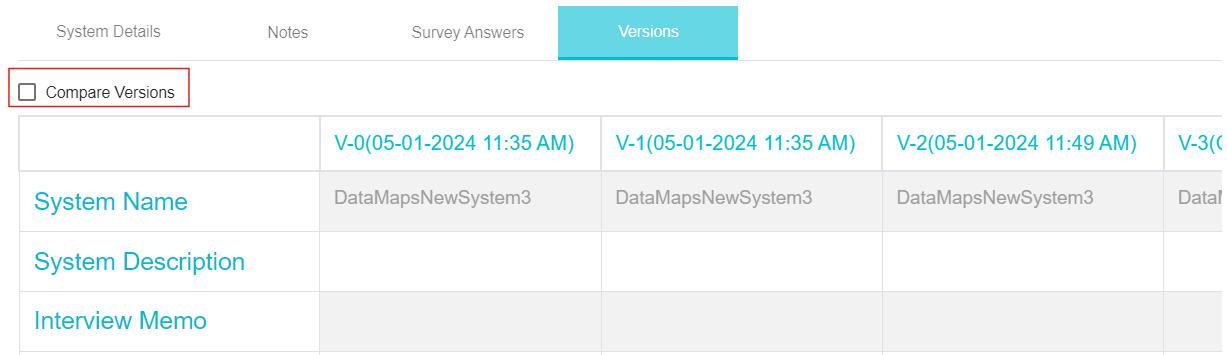
To view the versions, click on the Versions Section
Here all previous versions and the current version of the DataMap will be displayed. The fields and their values from the different versions are displayed next to each other to facilitate easy identification of changes between the versions.
Note: The latest or current version is the version with the highest numerical value (V-2) in the example below. This version shows all the current data. In the example below, changes have been made to the Point of Contact field. Version 0 (V-0) contains no value, version 1 (V-1) contains "Old Value" and the latest version (V-2) which contains Current Data has "Old Value, New Value".
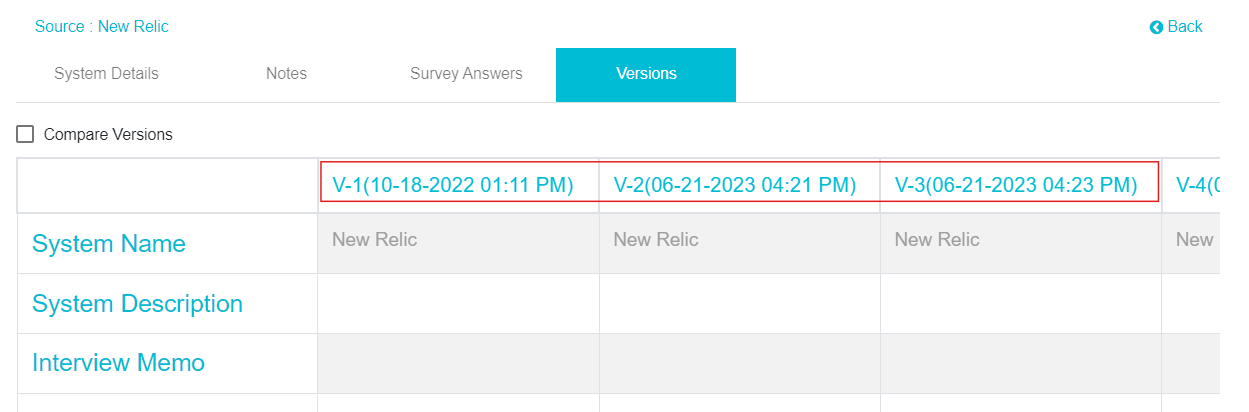
Different versions will be saved with the date and time stamp of when it was created.
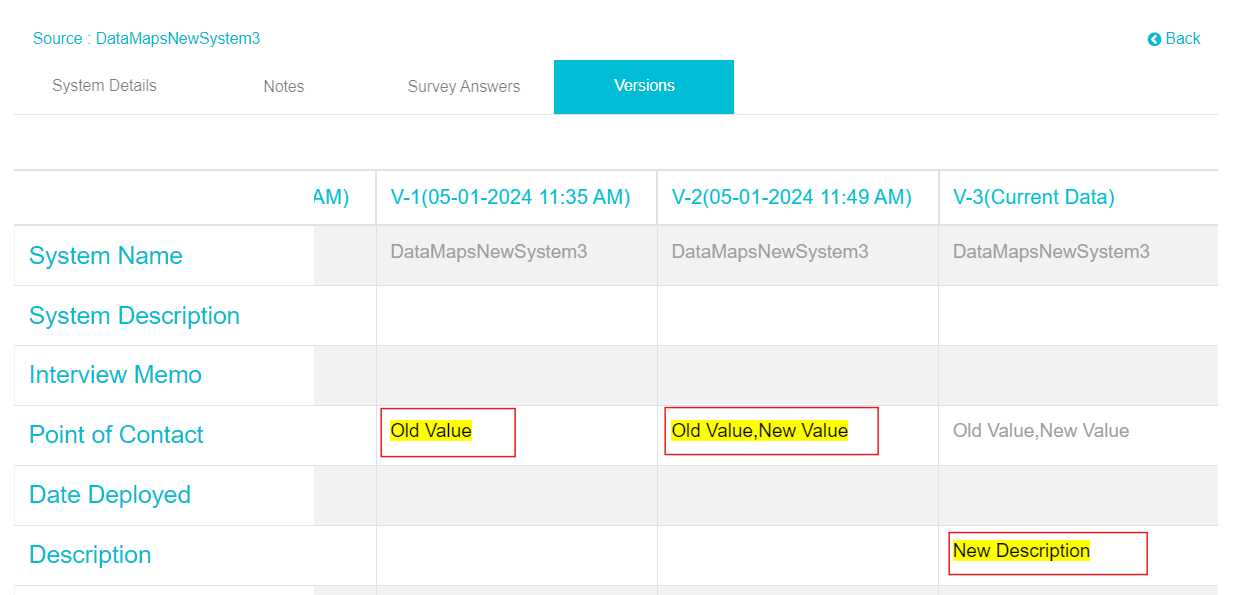
The changes made will be highlighted in their respective fields under the version in which the change was made. This is done to easily track when the different changes were made, or in other words, to track which changes were made with each version. In the example below, "Old Value" was added in V-1 and "Old Value, New Value" in V-2. However, in the current version, the Point of Contact field was not updated and hence under V-3, it is not highlighted. But, in the latest version, "New Description" was added in the Description field and that value has been highlighted
Click on Compare Versions to place two versions parallelly to compare them
Once you click on Compare Versions, from the drop-down menus that appear, select the two versions you want to compare with each other
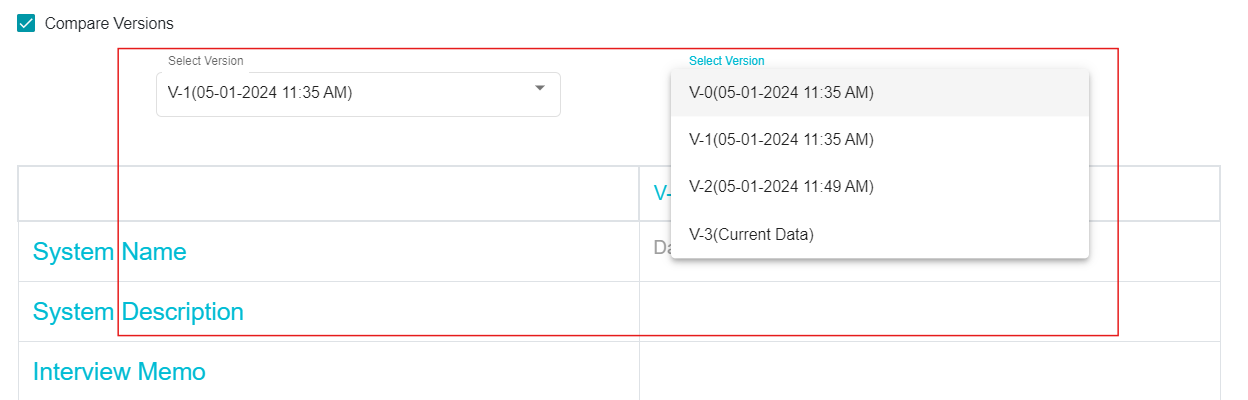
The two versions will now appear side-by-side and can be compared